|
Short reports on the programmes will be issued when results demand. Follow links on the right.
Report 1
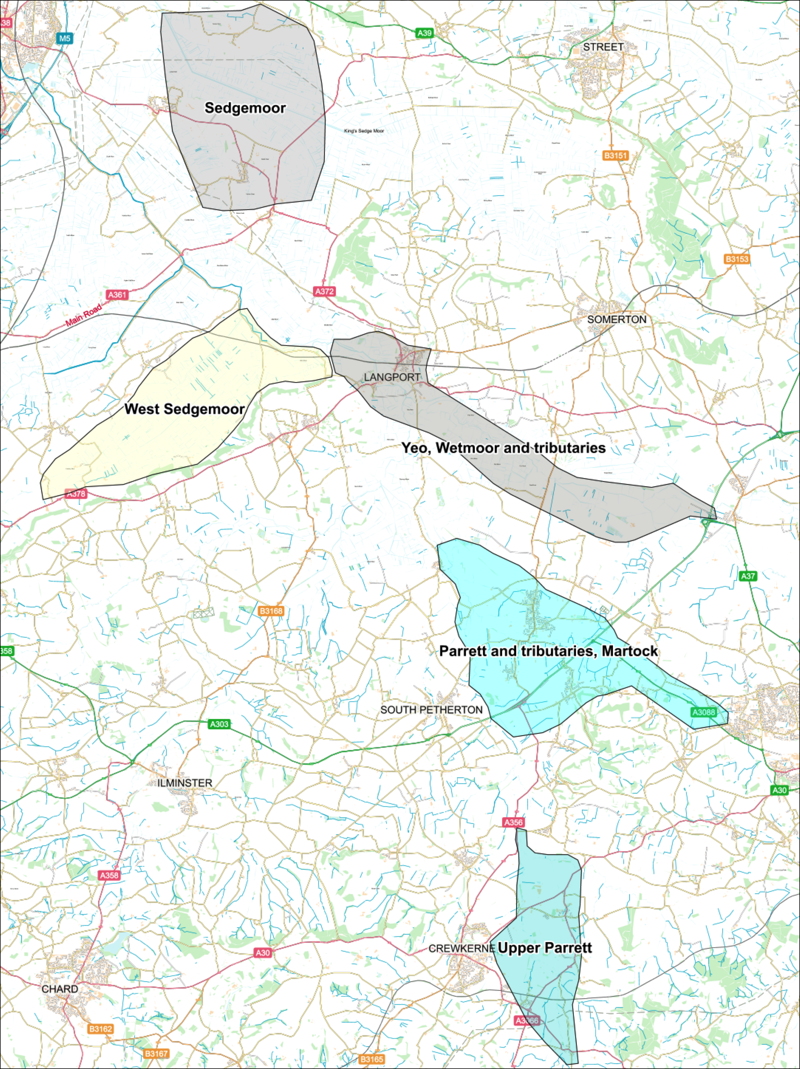
The Upper Parrett, Februay 2022. This initial survey showed clearly the large impact of sewage effluent from South Perrott, Crewkerne, Haselbury Plucknett and Merriott STWs. A large unprocessed sewage overflow noted in the report at Hazelbury Plucknett was subsequently traced (by the EA) to the nearby Dairy Farm. It nevertheless persisted through the year.
Report 2
Witcombe Bottom, May 2022. This is a small Moor fed by Witcombe Bottom Main Drain which is pumped into the Yeo at Long Load just upstream of Wetmoor. The drain is fed by effluent from Tintinhull STW and also (and mainly) by run-off from Witcombe Dairy. This runoff contribues between 1 and 4 tonnes of phosphate annually to the Yeo which is several times the Entrade offset removal target (0.95t) from the Yeo catchment.
Report 3
Wetmoor, July 2022. This report traces the change in phosphate concentration in Wetmoor over the seasons. The Moor is normally fed by small local streams within the SSSI that are free of excess phosphate. Phosphate enters the Moor when the inlets from the Yeo and Parrett are opened in summe, spreading slowly through the rhynes. This is reversed whenthe inlets are closed in autumn.
Report 4
The 2022 Drought. Thie drought reduced the Parrett to a minimum flow, almost all of which originated from the sewage works. The tributaries not fed by Yeovil Scarpland springs dried up. The phosphate concentration in the main river reached 4ppm in places. The phosphate load at Chiselborough was around 50kg/day, all from sewage works.
Report 5
Small tributary study, January 2023. This looked at small tributaries around Martock and showed a common baseline winter natural phosphate level in many. A few showed a small rise above this often tracable to field run-off. A significant feature is the much higher level in all tributaries few by sewage treatment plants. It also showed a dramatic increase in phosphate load in the Parrett when it was in spate and sediment phospate is mobilised.
Report 6
Parrett midsummer snapshot, June 2023. This survey was made during the drought of summer 2023. Most of the naturally fed tributaries of the Upper Parret were then very low or dry. Almost all the flowing water came from the outfalls of the Sewage Treatment Plants. Most sampling was done above and below each outflow and showed a phosphate boost after each which tailed off somewhat as phosphate was absorbed by sediment and river plants, until the next.
Report 7
Parrett Flow, August 2023. This surveys the flow of the Parrett under the A356 Road Bride at Chiselborough. This is where the Environment Agency monitors the Parrett River Flow continuously, putting the data online in real time. Phosphate measurements were made weekly enabling the phosphate load to be tracked over time. This reached a minimum in the drought period of around 40kg/day. It also showed how the load tracked the flow very closely, rising considerably when higher river flows molilisedphosphate in the sediment.
Report 8
Parrett Load, January 2024. This was a continuation of the Parrett Flow Study throughout the Winter Flood season. It also included a survey of floodwater in deep ditches, ponds and surace flood water. It showed how effective the increased water flow was in mobilising phosphate in river sediments and surface soil. It also indicated how effective the clay soil was in removing phosphate as water percolated though it.
|
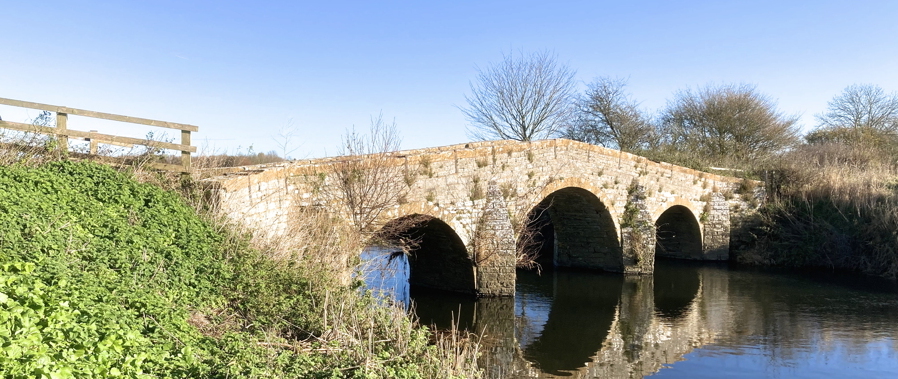 Pill Bridge across the Yeo at Witcombe. An ancient packhorse bridge one horse wide. Believed once to have been the limit of navigation by sea-going boats. Phosphate concentration 0.8 ppm .